本文由彭博指数产品经理于乔和Utkarsh Agrawal共同撰写。
在当前这个经济充满不确定性的时代,利率高企、地缘政治冲突加剧、贸易保护主义抬头等一系列因素,都让寻找具有韧性的投资机会变得越来越困难。尽管黄金等避险资产表现良好,但股票市场依旧是捕捉长期增长潜力的关键战场。基本面优秀的公司能够更好地应对市场波动,而动量强劲的行业板块则能够更快地适应政策变化和经济趋势。企业的这些特质可以吸引寻求稳定与增长的投资者群体。
彭博在约两年前推出了“彭博全球精英55指数”(简称“精英55指数”),采用为高动量行业板块分配更多权重的策略,衡量各行业板块中规模及盈利能力均处领先地位的企业的表现。我们已经在此前的博客文章中介绍过该指数背后稳健的方法论。步入2025年,让我们一起回顾该指数自2022年11月发布以来的表现。
截至2024年底,精英55指数表现明显优于其母指数——发达市场(除亚太)指数(DM ex APAC Index),累计超额回报达24.64%。通过彭博PORT工具进行的详细因子归因分析显示,这一超额回报中有8.12%来自选择效应,另有16.52%来自因子贡献。
风格因子对整体主动回报的贡献为6.77%,其中动量因子贡献了3.89%。行业配置同样对主动回报贡献了6.67%。这一结果十分符合预期,也增强了我们对该指数策略有效性的信心。
图1:精英55指数相对于母指数(DM ex APAC Index)的因子归因分析
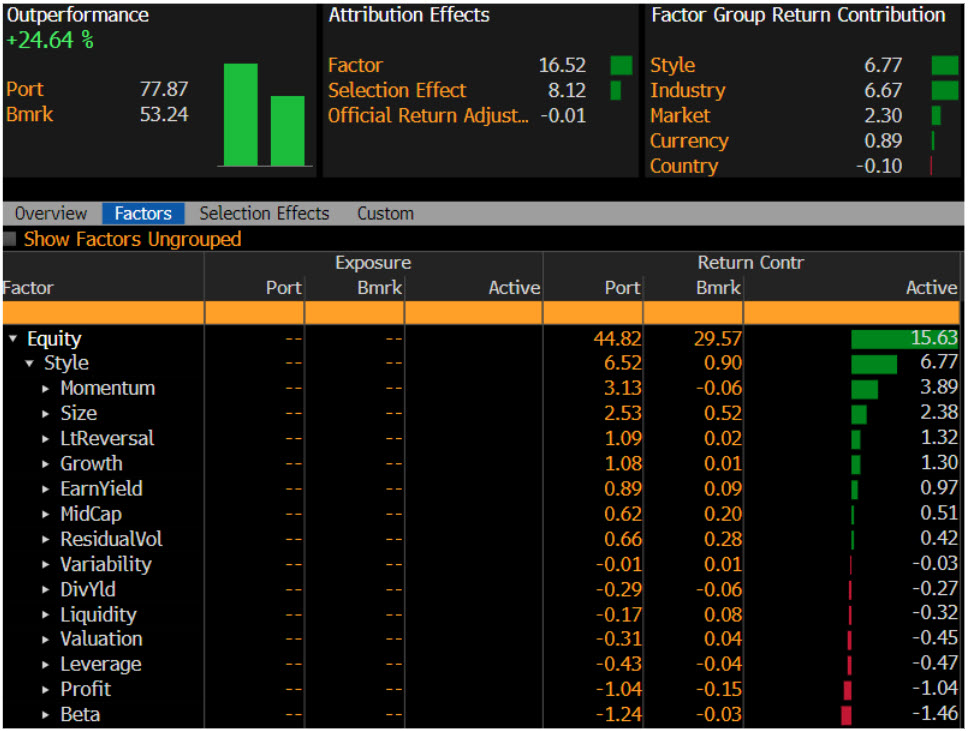
来源:彭博投资组合分析(MAC3多重资产整合模型)。统计时间为2022年11月1日至2024年12月31日。
进一步分析选择效应,我们可以看到科技和通信行业在主动回报中占据了主导地位,并有着最高的仓位超配权重。值得指出的是,英伟达的超配权重为3.73%,主动回报贡献则高达10.73%。从这一期间的选择效应来看,该指数方法有效地把握住了各行业中表现最强的龙头公司。
图2:选择效应归因分析
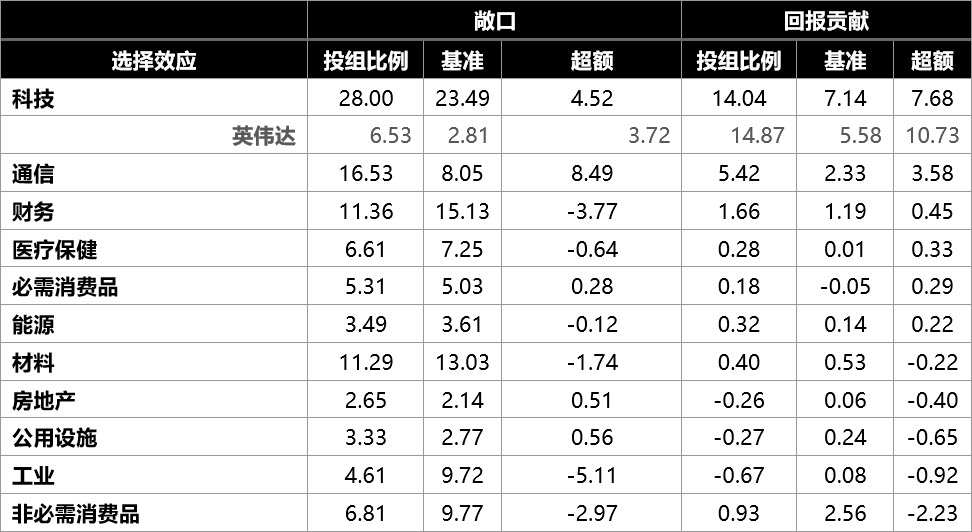
来源:彭博投资组合分析(MAC3多重资产整合模型)。统计时间为2022年11月1日至2024年12月31日。
过去两年来,精英55指数的实际表现验证了其方法论的稳健性,即从各行业中挑选具备增长潜力且财务状况优秀的龙头企业。这一方法在欧洲和新兴市场等其他地区也展现出显著韧性。自2015年3月30日以来,“欧洲精英55”回测指数相较于欧洲600指数实现了2.8%的超额回报,而相较于新兴市场指数,“新兴市场精英55指数”也录得了1.8%的超额回报。
图3:欧洲精英55指数与新兴市场精英55指数的模拟表现
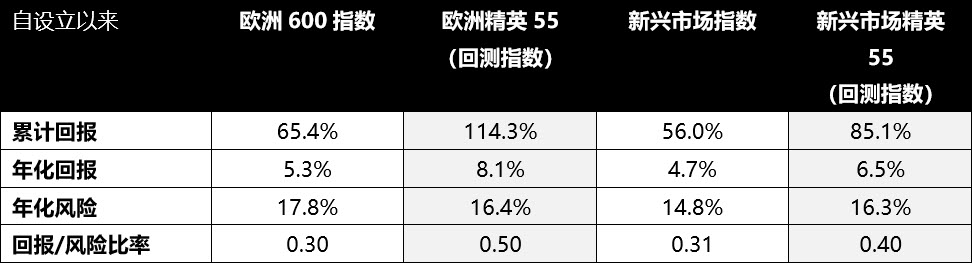
来源:彭博。统计时间为2015年3月30日至2024年12月31日。
在快节奏、高波动的金融市场环境下,能否找到正确的投资策略将决定最终的回报差异。这种创新型指数构建方法在全球市场中的未来持续表现将值得我们的关注。
凯基证券投资信托公司已推出一只基于“彭博全球精英55指数”(BGIE55T)的ETF产品——“KGI全球菁英55 ETF”,交易代码为00926 TT Equity。
敬请访问彭博终端的彭博指数概览功能I<GO>或浏览我们的网站,以进一步了解彭博指数并申请咨询彭博指数专家。
BLOOMBERG, BLOOMBERG INDICES and Bloomberg Global Industry Elite 55 Index (the “Indices”) are trademarks or service marks of Bloomberg Finance L.P. Bloomberg Finance L.P. and its affiliates, including Bloomberg Index Services Limited, the administrator of the Indices (collectively, “Bloomberg”) or Bloomberg’s licensors own all proprietary rights in the Indices. Bloomberg does not guarantee the timeliness, accuracy or completeness of any data or information relating to the Indices. Bloomberg makes no warranty, express or implied, as to the Indices or any data or values relating thereto or results to be obtained therefrom, and expressly disclaims all warranties of merchantability and fitness for a particular purpose with respect thereto. It is not possible to invest directly in an Index. Back-tested performance is not actual performance. Past performance is not an indication of future results. To the maximum extent allowed by law, Bloomberg, its licensors, and its and their respective employees, contractors, agents, suppliers and vendors shall have no liability or responsibility whatsoever for any injury or damages – whether direct, indirect, consequential, incidental, punitive or otherwise – arising in connection with the Indices or any data or values relating thereto – whether arising from their negligence or otherwise. This document constitutes the provision of factual information, rather than financial product advice. Nothing in the Indices shall constitute or be construed as an offering of financial instruments or as investment advice or investment recommendations (i.e., recommendations as to whether or not to “buy”, “sell”, “hold”, or to enter or not to enter into any other transaction involving any specific interest or interests) by Bloomberg or a recommendation as to an investment or other strategy by Bloomberg. Data and other information available via the Indices should not be considered as information sufficient upon which to base an investment decision. All information provided by the Indices is impersonal and not tailored to the needs of any person, entity or group of persons. Bloomberg does not express an opinion on the future or expected value of any security or other interest and do not explicitly or implicitly recommend or suggest an investment strategy of any kind. Customers should consider obtaining independent advice before making any financial decisions. © 2025 Bloomberg. All rights reserved. This document and its contents may not be forwarded or redistributed without the prior consent of Bloomberg.